

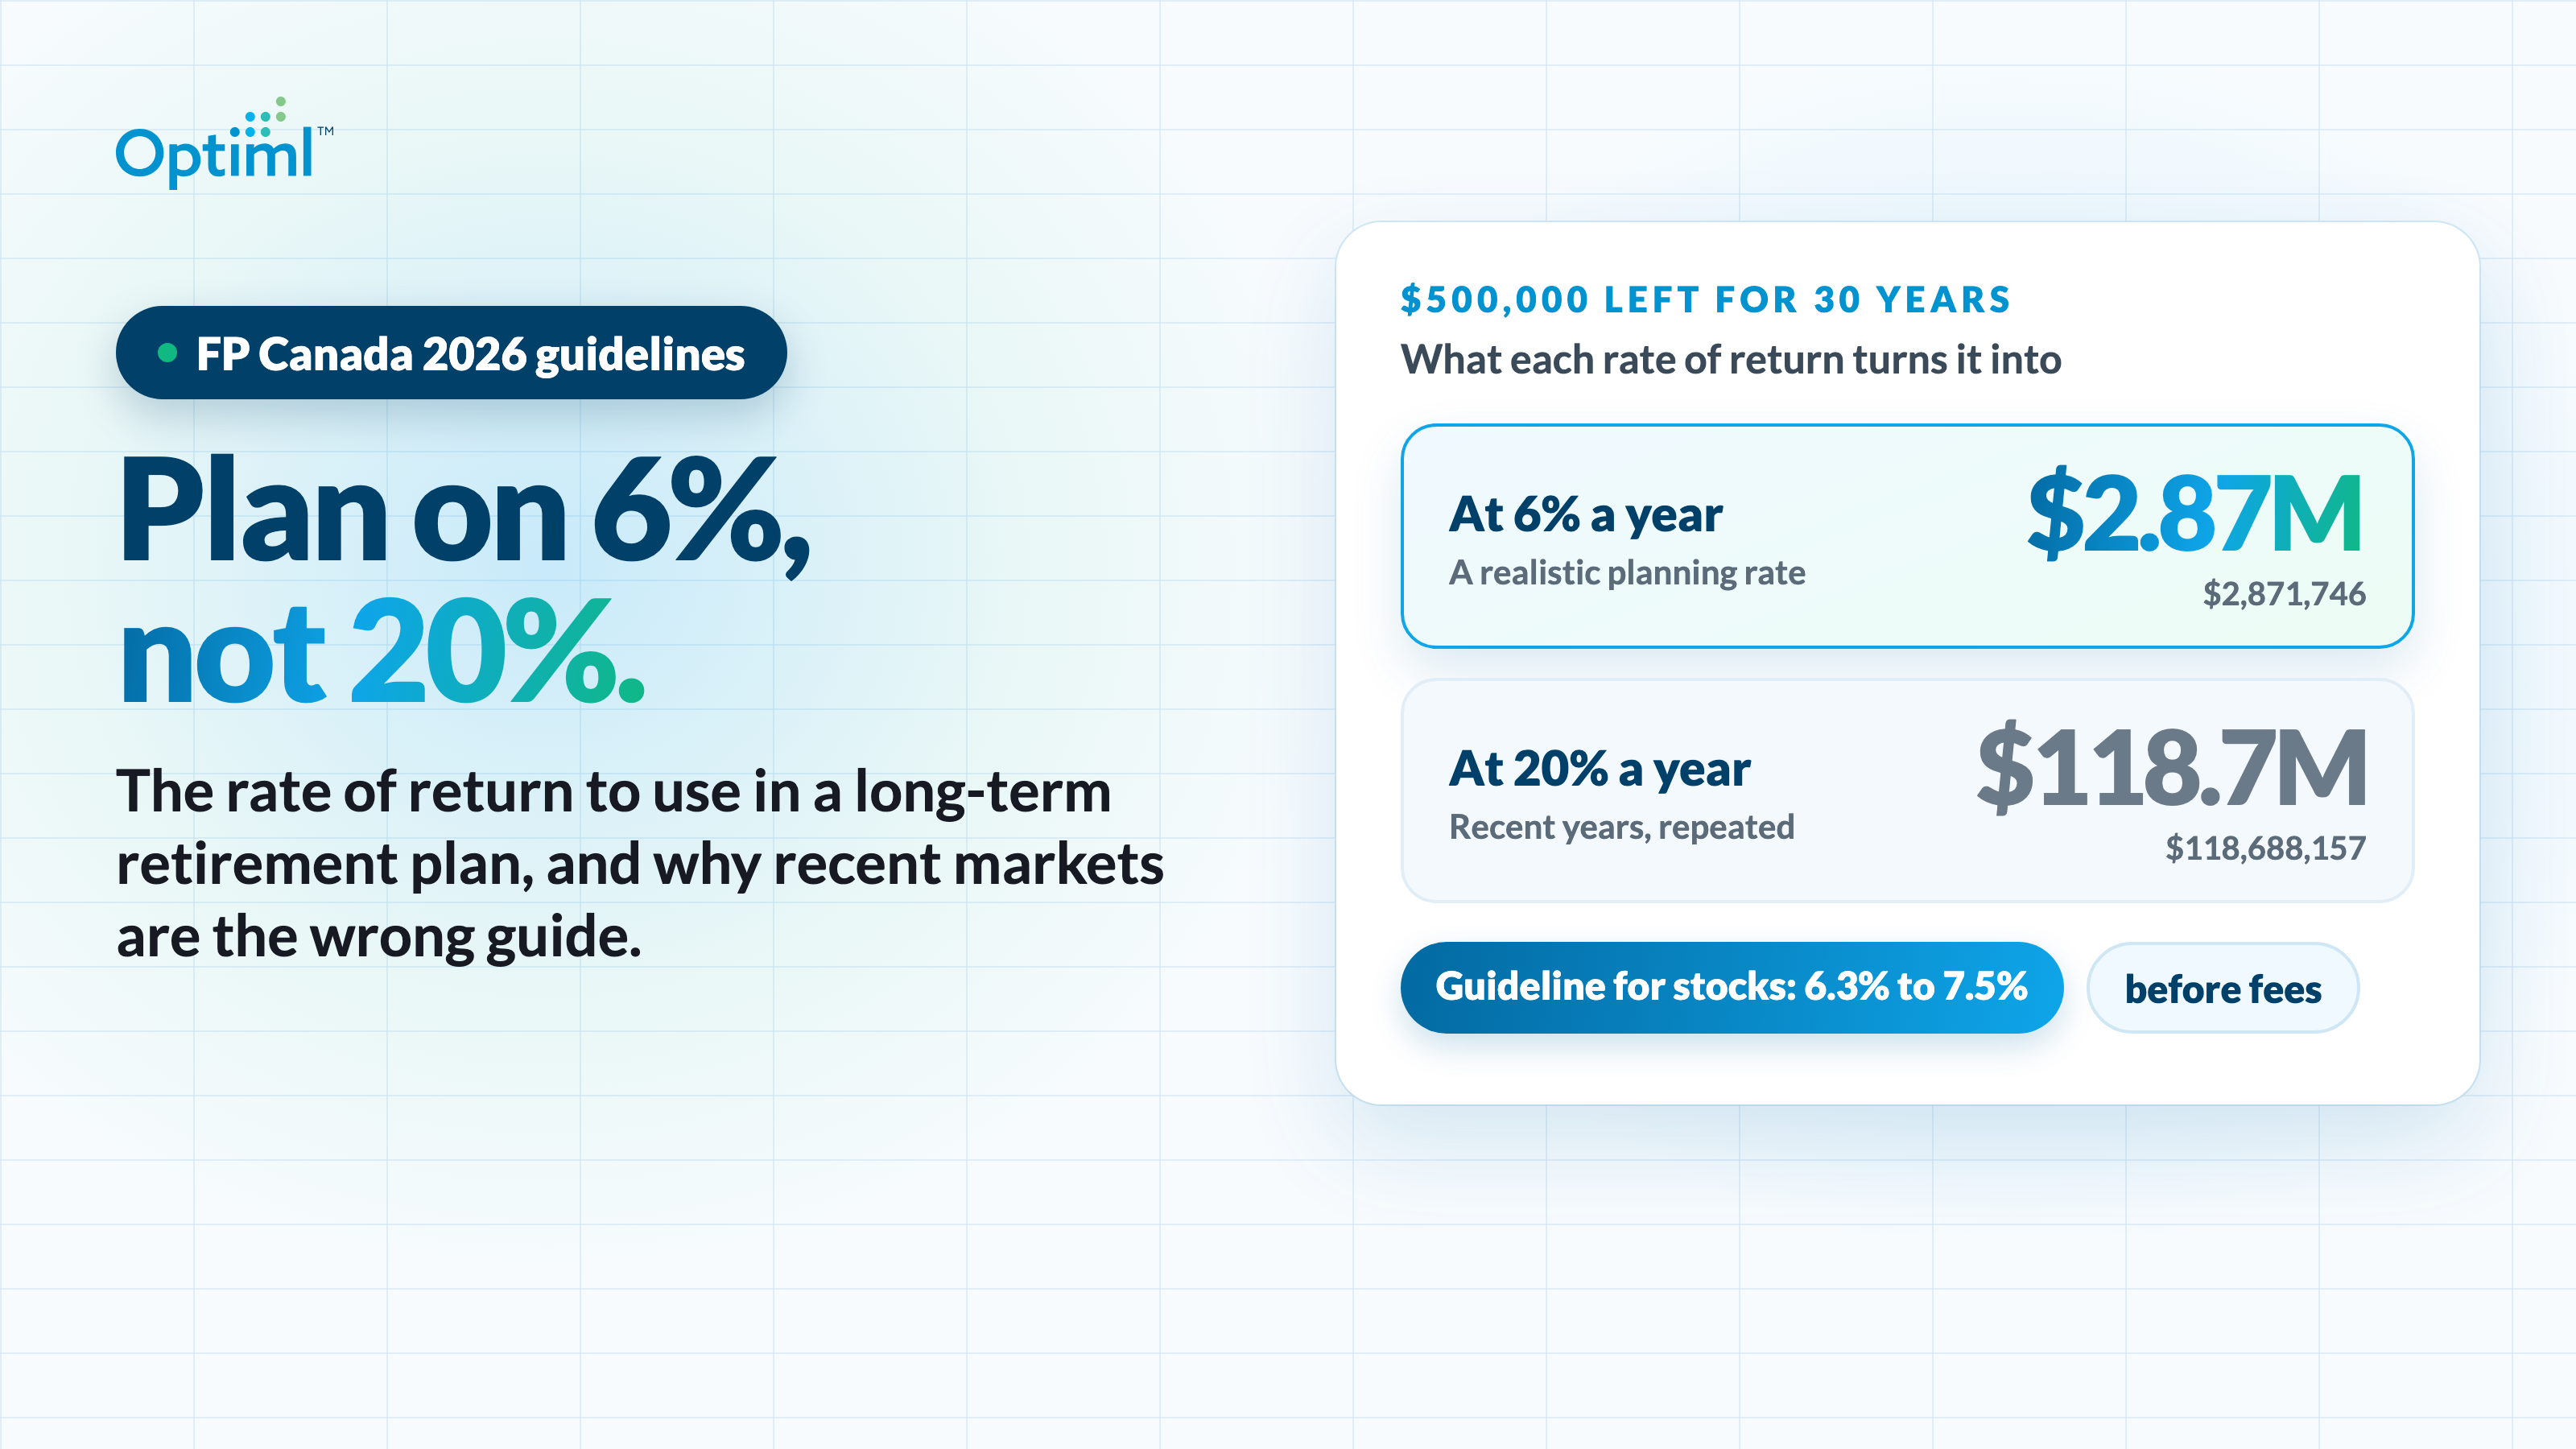
For a retirement plan that runs 10 years or more, a realistic rate of return for most Canadian portfolios is roughly 4% to 6.5% a year before fees, depending on your mix of stocks and bonds. That range is built on FP Canada's 2026 Projection Assumption Guidelines. Optiml prefills 6%, which sits inside it.
But that's rarely the number people reach for. The S&P 500 returned 26.29% in 2023 and 25.02% in 2024. The S&P/TSX Composite Index returned 31.7% in 2025, its third year in a row of double-digit returns and its best year since 2009. After a run like that, plugging 20% into a retirement plan feels reasonable.
Then the plan says you'll be worth hundreds of millions of dollars.
Could that happen? Yes. Is it something to expect, or to plan on, over 30 years or more? No.
What 20% does to a plan
Few inputs move a long-term plan like the growth rate, because every year's return compounds on the last. Imagine you invest $500,000 today, add nothing, and leave it for 30 years.
At 20%, half a million dollars becomes $118.7 million. Start with $1 million and it's $237.4 million. That's where the hundreds of millions come from: 20% a year, compounded for three decades.
Even 10% deserves a second look. It sounds grounded, since the S&P 500 has an average annual return of 10.51% since 1957. But 10% produces about three times the money 6% does. And the single point between 5% and 6% is worth $710,775 on its own.
That one assumption shapes when you can retire, how much you can spend and what you leave behind.
What FP Canada's 2026 guidelines say
Every year, the Institute of Financial Planning and FP Canada Standards Council jointly publish the Projection Assumption Guidelines. The 2026 edition came out in April. It's built from the Canada Pension Plan (CPP) and Quebec Pension Plan (QPP) actuarial reports, an industry survey, 50 years of historical returns and current market valuations.
In the guidelines' own words, "These Projection Assumption Guidelines are intended as a guide and are appropriate for making realistic and defensible long-term (10+ years) financial projections."
Here are the 2026 rates. They're nominal, meaning they include inflation, and they're before fees.
The highest rate on the list is 7.5%, for emerging market stocks. No asset class comes close to 10%, let alone 20%. The full 2026 guidelines lay out the method behind every number.
The rate for your portfolio
You don't hold one asset class. You hold a mix, so your planning rate is a blend of each class's rate, weighted by how much of your portfolio sits in it.
We applied FP Canada's 2026 rates to four common mixes. This is Optiml's arithmetic on FP Canada's numbers, a weighted average rounded to 0.1%. The stock portion of each mix is split 30% Canadian, 40% U.S., 25% international developed and 5% emerging markets. The conservative mix also holds 10% in cash and Guaranteed Investment Certificates (GICs).
The mix matters. Going from all stocks to balanced lowers your planning rate by 1.3 points before fees. Fees matter just as much. A balanced portfolio paying 2% plans on 3.2%, not 5.2%.
So does your time horizon. Over 5 years, an all-stock portfolio can land far from its long-run average. Over 40 years, the average is much more dependable. The table shows the guideline rates in full, which is where a 40-year plan lands. For shorter horizons, the calculator trims the rate on stocks: all stocks comes to 6.0% before fees over 10 years and 5.6% over 5. That trim is Optiml's own, sized from the plus or minus 0.5% the guidelines allow.
The guidelines include their own worked example. A portfolio of 5% short-term, 45% fixed income, 20% Canadian, 20% U.S. and 10% international stocks comes to 4.8% before fees, and 3.5% after 1.3% in fees.
To find your own number, use our free Planning Rate of Return calculator. Enter your portfolio mix (cash and GICs, bonds, and Canadian, U.S., international and emerging-market stocks), your annual fees and your time horizon. It applies FP Canada's 2026 guideline rates, trims the rate on stocks for shorter time horizons, and returns the rate of return to plan with, after fees. It takes about a minute.
Why the conservative number is the right one
You might average 10% a year through retirement. No one can rule it out. But a realistic rate of return for retirement is one you can defend for decades, and four things pull it below recent returns.
Recent returns aren't expected returns
Big years can make the long run look better than it is. The guidelines explain why: "a run-up in stock prices caused by increasing valuations will push historical returns up and expected returns down, making the historical return ... an upwardly biased estimate of the expected return."
The better the recent run, the more caution your expected rate of return calls for.
Fees come off the top
Every guideline rate is before fees. The guidelines spell it out: "Note that the administrative and investment management fees paid by clients both for products and advice must be subtracted to obtain the net return." Those fees "typically range from 0.5% to 2.5%," depending on how your money is managed. Plan on the return you keep.
The order of returns matters once you're withdrawing
Consider an example. Two retirees each start with $1,000,000 and withdraw $60,000 at the start of every year for 10 years. Both get the same ten annual returns, which average 8%: -15%, -10%, 5%, 8%, 10%, 12%, 12%, 15%, 18% and 25%.
- Retiree A gets them in that order, bad years first, and ends with $807,018.
- Retiree B gets them in reverse, good years first, and ends with $1,338,221.
Same average return. A $531,203 difference. With no withdrawals, both would end at exactly $2,030,454, which is why the order only matters once you're drawing on the money. We go deeper in why the sequence of returns matters more than the average.
FP Canada builds in its own safety margin
For each equity class, "a safety margin of 0.50% is deducted ... to compensate for the variability of the long-term returns." Planners may then move within plus or minus 0.5% of the guideline rates and still comply. But the guidelines draw a clear line: "it would not be prudent to increase return assumptions to 'force' a projection that secures a client's goal."
If a plan only works at 10% or 20%, the growth rate isn't what needs to change. Spending, timing and how you draw on your accounts are where to look.
Where Optiml's 6% fits, and how to change it
Every investment account in Optiml has its own rate of return field, prefilled at 6%. That sits just under FP Canada's guideline rates for stocks (6.3% to 7.5% before fees) and close to the all-stock, low-fee row of the table above (6.2%). Optiml's default inflation rate is 2.1%, the same figure as the 2026 guidelines.
Six percent is a sensible place to start. If you hold bonds or GICs, or pay higher fees, your number is lower, and the Planning Rate of Return calculator shows you by how much. Once you have it, enter it as your Investment Growth Rate. There are two ways to do that.
- Account by account. Change the rate of return on each investment account.
- All at once. In Advanced Settings, Investment Growth Rates changes the growth assumption for all your investments in one place. Choose Fixed for one constant annual rate, or Dynamic for a different rate year by year. Dynamic rates are on Pro+ and Legacy.
Why use the same rate in every account
Optiml's goal-based plans aren't tied to a fixed deposit or withdrawal order. Each year, they decide which accounts to deposit to and withdraw from to reach your goal. That freedom is the point. It also means the plan takes your growth rates at face value.
If one account is given a higher growth rate than another, the plan will favour the account with the higher rate.
Imagine you give your non-registered account 7% and your Tax-Free Savings Account (TFSA) 5%. The plan will lean toward putting money in the non-registered account over the TFSA. In real life, that makes no sense. The same investments earn the same return in either account, and the TFSA's growth is tax-free. The result is an artifact of the inputs, not a strategy you could actually follow.
That's why Optiml recommends one consistent rate across all investment accounts in a goal-based plan. Use your blended, whole-portfolio rate. When you choose a goal-based strategy and your accounts have different growth rates, Optiml shows a prompt offering to average them so they're consistent across accounts. It's optional, and you can decline.
What if your accounts hold different investments?
Say you hold GICs in your TFSA and stocks in your Registered Retirement Savings Plan (RRSP). It's still one portfolio. Work out the blended rate for the whole thing and use it in every account.
What you hold in which account is a choice, and you can change it. Your plan shouldn't treat it as a permanent feature of the account. Use the same rate everywhere and the differences your plan works with are the real ones, like how each account is taxed.
Test the bad years instead of guessing them
It's tempting to shave your growth rate to "allow for" a bad market. But a lower average is still an average. It can't show you what happens when a crash lands in the wrong year.
FP Canada's guidelines point the same way, telling planners to run sensitivity analysis such as a Monte Carlo analysis. So keep a realistic rate and stress-test the plan instead. Optiml's Success Score Monte Carlo runs every plan against the Core 6, six real market eras including the 2008 crash and a lost decade. Read more on how the Core 6 stress-tests every plan.
The best rate of return for your plan is the one you can defend: built on FP Canada's 2026 numbers, adjusted for your mix and your fees, and tested against markets that actually happened.
Enjoy the 20% years. Just don't plan on them.
Frequently asked questions
What rate of return should I use for retirement planning in Canada?
For a plan of 10 years or more, roughly 4% to 6.5% a year before fees for most portfolios. Applying FP Canada's 2026 guideline rates, an all-stock portfolio comes to about 6.5%, a balanced 60/40 portfolio about 5.2% and a conservative mix about 4.4%. Subtract your fees to get the rate to plan with. Optiml prefills 6%.
Is 6% a realistic rate of return?
For an all-stock portfolio with low fees, it's close. All stocks comes to 6.5% before fees and 6.2% after 0.25% in fees, based on FP Canada's 2026 rates. With bonds or GICs, or higher fees, your rate is lower. A balanced portfolio paying 1% in fees comes to 4.2%.
What is the average stock market return?
The S&P 500 has an average annual return of 10.51% since 1957. That's one U.S. index, before fees. For long-term projections, FP Canada's 2026 guidelines use 6.3% to 7.5% before fees for stocks, and warn that valuation-driven run-ups make historical returns an upwardly biased estimate of expected returns.
Should I use the same rate of return for my TFSA and RRSP?
Yes, in a goal-based plan. Optiml's goal-based plans choose which accounts to deposit to and withdraw from each year, so they favour any account with a higher growth rate. The same investments earn the same return in any account, so Optiml recommends one blended, whole-portfolio rate in every investment account, even if you hold GICs in one and stocks in another.
What rate should I use for a plan shorter than 10 years?
FP Canada's guidelines are built for projections of 10 years or more and "in no way represent predictions about short-term returns." For projections under 10 years, planners may use the actual rates on fixed-term investments held to maturity, such as a GIC's actual rate.
Ready to optimize your retirement plan?
Join thousands of Canadians making smarter financial decisions with Optiml.
Start Free Trial