

Every pre-retiree I talk to eventually asks some version of the same question. What would my plan actually do in another 2008? What about a decade like the 2000s, where the market went nowhere for ten years? Most planning tools answer with a shrug and a single smooth projection line that assumes the good years just keep coming.
That is not an answer. It is a hope.
The Core 6 changes that. It takes your plan and runs it against six real market eras that actually happened, then tells you exactly where it holds and where it runs short. You stop guessing about history and start reading it.
What the Core 6 Actually Is
The Core 6 is a set of six default historical stress scenarios that run automatically on every plan you build going forward. You do not have to set them up. They save to your profile and run in the background every time you create a new plan.
One thing to be clear about: the Core 6 is not retroactive. It does not reach back and reprocess plans you saved before this feature existed. It applies to new plans from here on out. Build a fresh plan and the six scenarios come with it.
Each scenario is a specific combination of average growth, a year-by-year return range, and average inflation, drawn from a real period in market history. Your full plan, your accounts, your withdrawal sequence, your CPP (Canada Pension Plan) and OAS (Old Age Security) timing, gets pushed through all six.
The Six Scenarios, One by One
Here is what each era was, and the exact parameters Optiml models it with. The history is context. The modeled numbers are what actually run against your plan.
Long-Run Average
This is the steady baseline, the version of the future where nothing dramatic happens and returns land near their long-term norm. It is the reasonable middle case, not a stress test.
Optiml models it at 8.3% average growth and 3.0% inflation.
The 2008 Crash
In 2008 the S&P 500 fell roughly 37% for the calendar year, and about 42% peak to trough. Near-retirees who were sitting in target-date funds that were supposed to protect them still lost 20% or more. It is the crash most people in their fifties and sixties remember in their gut.
Optiml models it at 6.8% average growth, a year-by-year range of -13.9% to +12.3%, and 2.0% inflation.
The Great Depression (1929-38)
The Dow fell somewhere between 79% and 89% from its 1929 peak to the 1932 bottom, and it did not reclaim that peak for years. This is the worst-case bookend, the scenario that tests whether a plan can survive a genuine collapse and a long climb back.
Optiml models it at 6.0% average growth, a year-by-year range of -27.3% to +30.7%, and 0.9% inflation.
High Inflation (1966-82)
This era is the one most Canadians underestimate. There was no single dramatic crash. Instead, inflation climbed from around 1% to roughly 14.5%, and the Dow quietly lost about 73% of its real value even as the nominal number moved sideways. The threat here was not a crash. It was inflation eating your purchasing power year after year.
Optiml models it at 7.1% average growth, a year-by-year range of -14.7% to +25.4%, and 4.8% inflation.
The Lost Decade (2000-09)
From 2000 to 2009 the S&P 500 returned roughly -0.9% annualized. A dollar invested at the start became about 91 cents at the end. Two busts, dot-com and 2008, bracketed a decade that went nowhere. This one matters because it shows how a flat "average" can still break a plan that is withdrawing money the whole way through. The sequence, not just the average, is what does the damage.
Optiml models it at 5.9% average growth, a year-by-year range of -13.9% to +17.2%, and 2.0% inflation.
The Bull Market (1982-99)
From 1982 to 1999 the S&P 500 rose about 20% annualized. This is the best case that actually happened, the other bookend. It belongs in the set for a simple reason: a plan that has only ever been tested against good years has never really been tested at all. Seeing your plan clear the bull market confirms your upside, and seeing where it lands next to the hard scenarios shows you the full spread.
Optiml models it at 11.9% average growth, a year-by-year range of -2.4% to +31.7%, and 2.9% inflation.
Pass, Fail, and the Plan Score
Each of the six scenarios returns a clean result: Pass or Fail. A Pass means your plan fully funds your desired lifestyle through the entire horizon under that era's conditions. A Fail means it runs short somewhere along the way.
The six results roll up into a single Plan Score out of 100, shown right on your Plan Summary. It is the fast read on how your plan holds up across the full spread of history, from the Great Depression to the bull run.
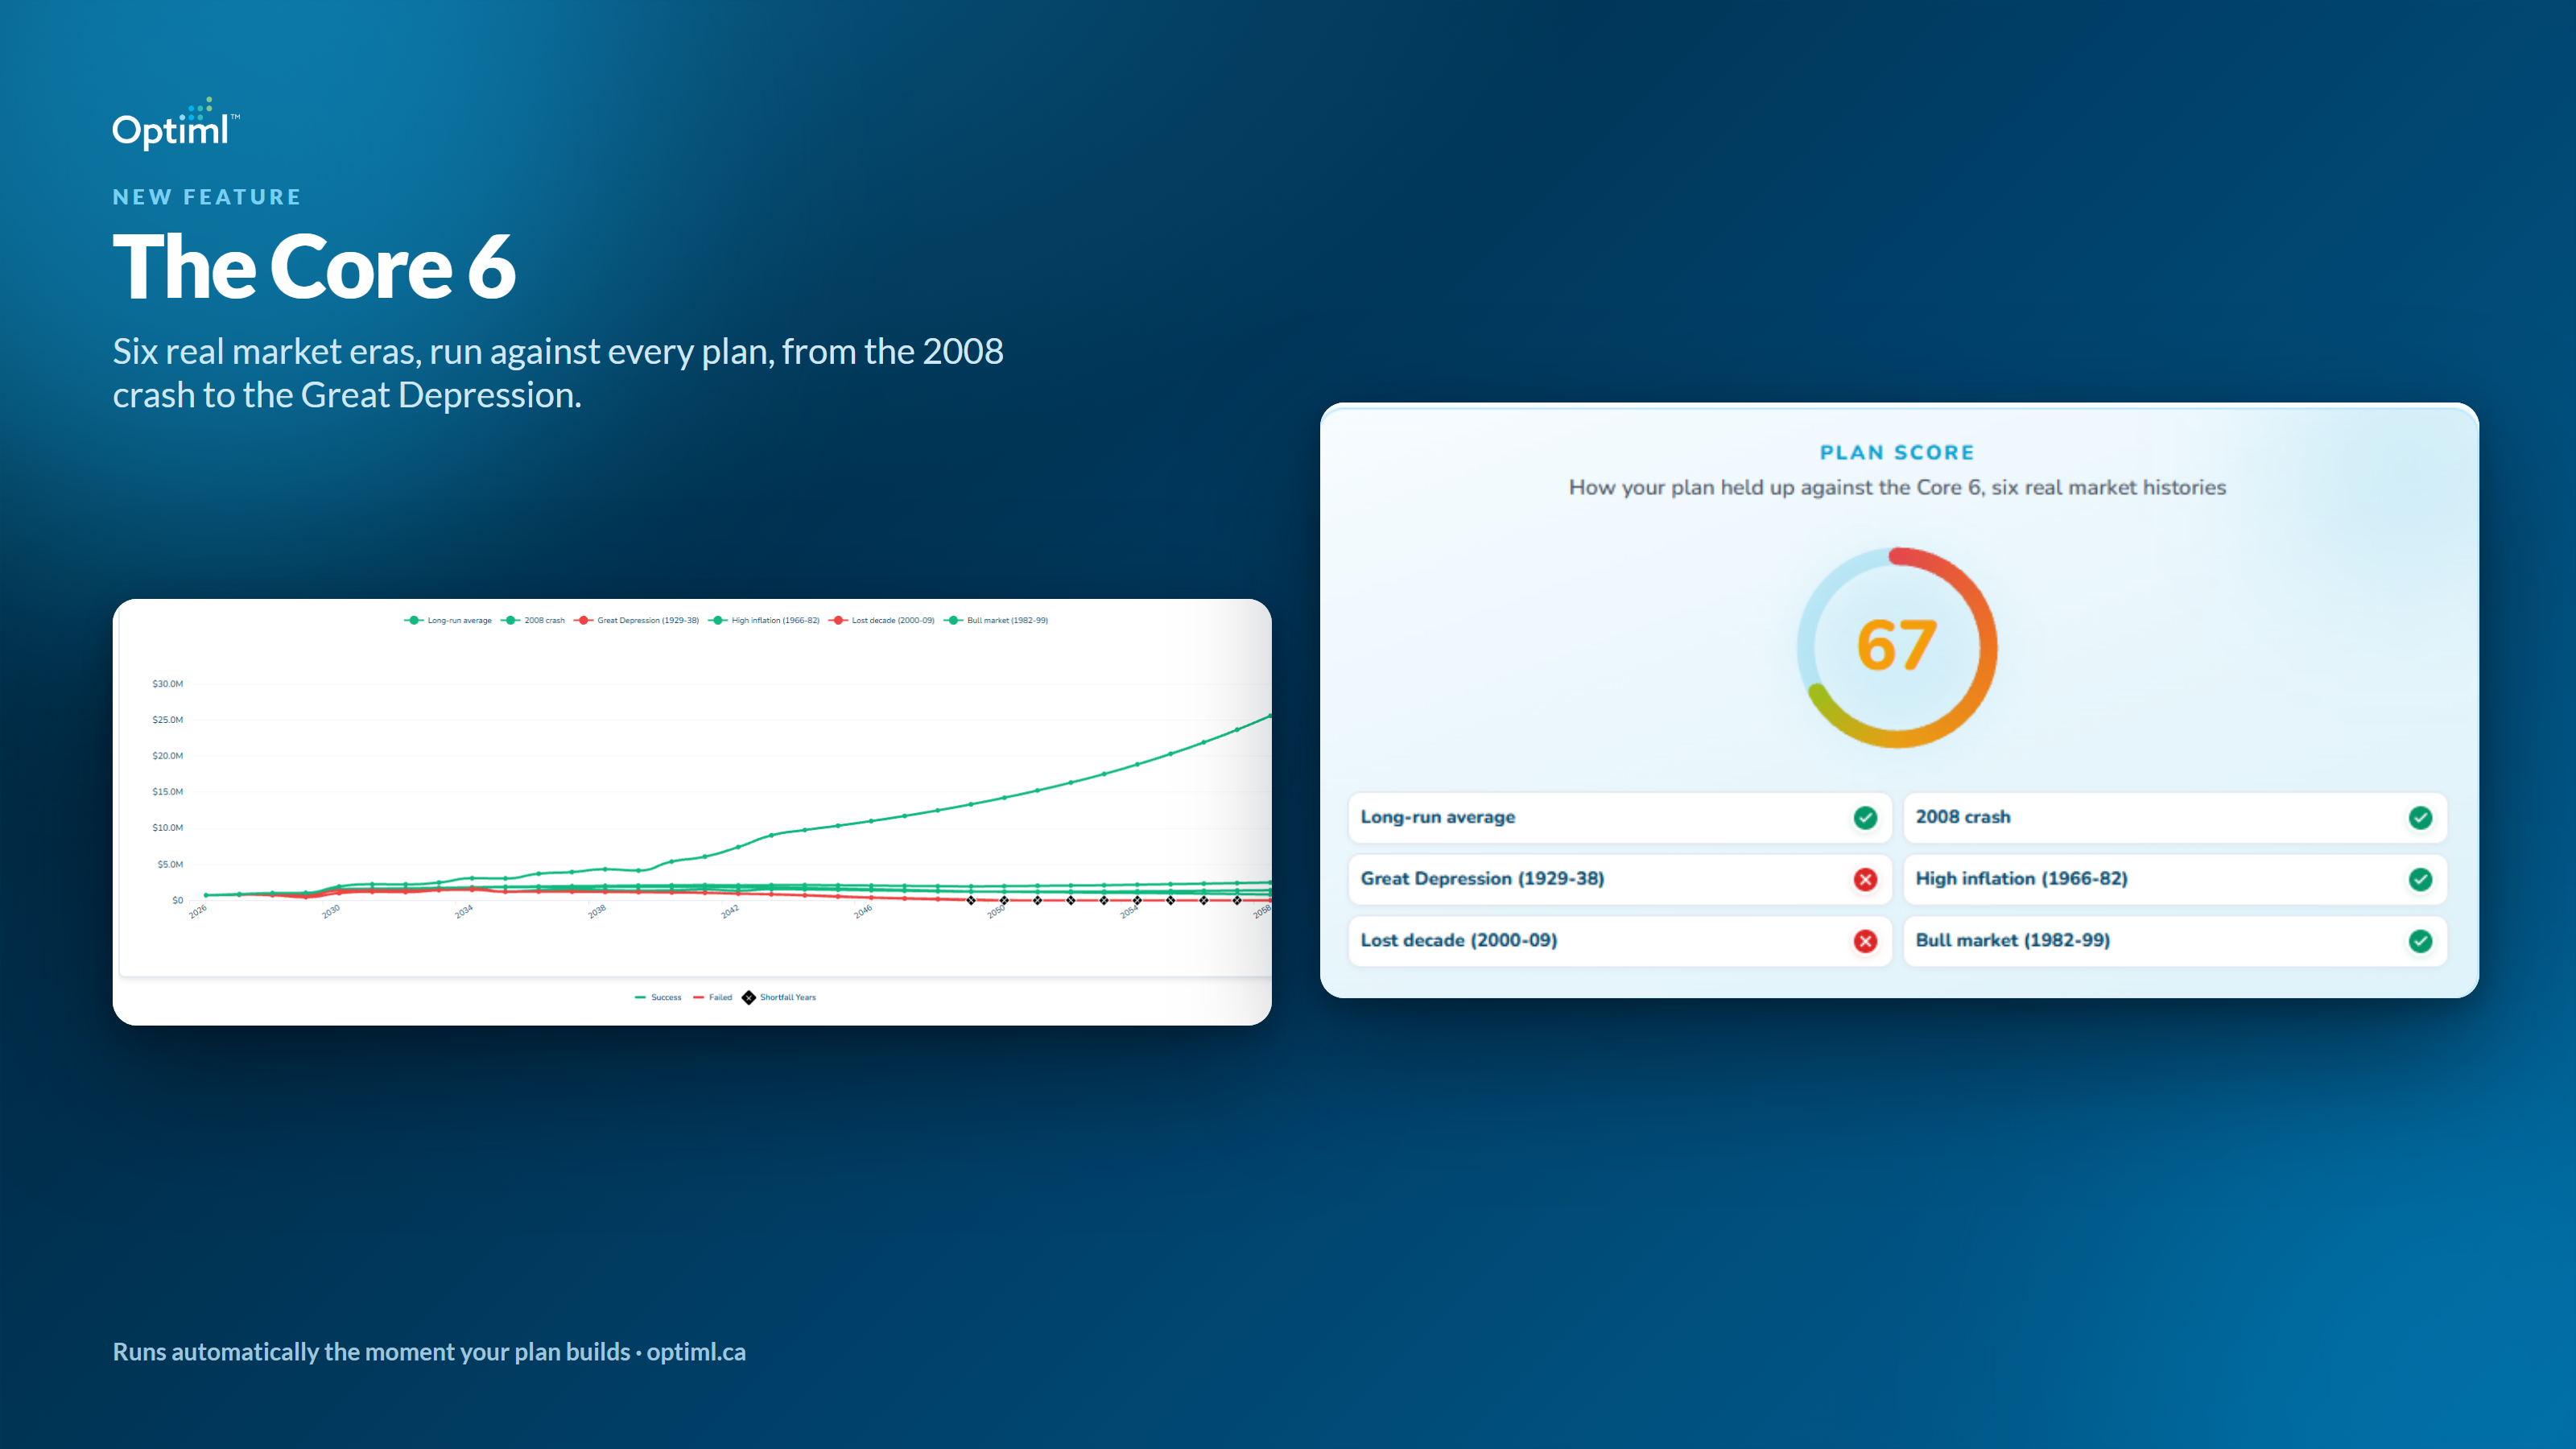
To make this concrete, here is one sample plan we built to show the feature in action. It scored 67, with 4 of the 6 scenarios passing. That is a single illustration, not a typical result, a target, or a number you should expect. Every plan is different, and the two scenarios that fail for one person will not be the two that fail for another. The point of the sample is only to show what the output looks like, never to imply any particular dollar or estate figure.
Scenario Graphs and Failed Scenario Details
A score tells you whether a scenario passes. The Scenario Graphs tell you how. Optiml plots your portfolio balance across all six scenarios over your full horizon, say 2026 to 2058, on one line chart. You can see the bull market arcing up, the Great Depression grinding along the bottom, and everything in between, all against the same timeline.
Shortfall years are marked directly on the chart. If a scenario runs short, you see the exact year the line crosses into trouble.
Then there is the Failed Scenario Details tab. This is where a Fail stops being a red flag and becomes a to-do. It shows you precisely when and why a scenario falls short: which year expenses stop being covered, and what was happening in the plan at that moment. That is the difference between "your plan might be risky" and "your plan falls short in 2041 under the lost-decade sequence, here is the gap." One you can act on.
Core 6 vs Success Score: Two Lenses, One Question
If you already use Optiml, you know the Success Score. It is worth being precise about how the two relate, because they answer the same underlying question from different directions.
The Success Score is a measure of broad statistical resilience. It is built from 50 market scenarios drawn from more than 50,000 generated return paths, a Monte Carlo approach that asks: across a huge range of possible futures, in what share of them does your plan hold up? It is the wide-angle lens. Thousands of possible tomorrows.
The Core 6 is the opposite lens. Six specific, named eras that really happened. Not "a bad 15% of futures," but "1929," "2008," "the 1970s." Periods you can picture, point to, and reason about.
They are complementary, not competing. The Success Score gives you the breadth. The Core 6 gives you the names. Use both and you see your plan from every angle worth seeing it from.
Make the Six Your Own
The six defaults are a strong starting set, but they are not fixed. You can override them and configure your own custom scenarios, name them, and set their growth and inflation parameters to run on every plan going forward.
Worried about a sustained inflation shock beyond the 1970s? Build one. Want to see a flat market that neither crashes nor climbs, just drifts? Set it up. The Core 6 is your default lens on history, and you can grind that lens to your own concerns.
Consistent With the Portfolio You Actually Hold
One more improvement that sits underneath all of this. Optiml now saves your default portfolio allocation when the Success Score generates its scenarios. That means your stress-test results stay consistent with the mix of assets you actually hold, rather than drifting toward a generic default. The scenarios test your portfolio, not a stand-in for it.
How to Use It
If You Already Have Optiml
Build a new plan and you will find your Plan Score and the six scenario results on the Plan Summary. Remember that this applies to new plans, not to old saved ones, so if you want the Core 6 on a strategy you built months ago, rebuild it fresh.
When you see a Fail, open the Failed Scenario Details tab and find the shortfall year. Then treat it as a lever, not a verdict. Adjusting your withdrawal timing, shifting when you start CPP or OAS, trimming spending in the early years, or adding to contributions before retirement can all move a scenario from Fail to Pass. Change the input, rerun, watch the score respond. That is the whole point of a living model.
If You Are Deciding Whether to Try Optiml
Here is the plain case for this kind of depth. A plan that shows you one smooth projected line is showing you one future, the one where things go fine. It cannot tell you what happens if you retire into a lost decade or a 2008. The Core 6 answers that directly, by name, and marks the exact year your plan would run short if it did. That is the difference between a plan you hope holds and a plan you have pressure-tested.
Why This Matters for Canadians Specifically
This ties straight into sequence-of-returns risk, the reason the order of your returns matters more than their average once you are withdrawing money. The lost decade scenario makes it visible: a flat ten-year average can still fund a plan or fail it depending on when the bad years land.
For Canadians there is a sharp edge to this. Once your RRSP (Registered Retirement Savings Plan) converts to a RRIF (Registered Retirement Income Fund), your minimum withdrawal each year is set off your prior year-end balance, regardless of what the market just did. A bad year does not lower your required draw. You can be forced to sell into a downturn at exactly the wrong moment. Stress-testing your RRIF conversion timing against the Core 6 shows you whether your plan absorbs that or buckles under it. If you want the deeper mechanics, we wrote about it here: the hidden risk in retirement: why the sequence of returns matters more than the average.
The Bottom Line
You cannot know which future you will retire into. But you can know how your plan behaves across the ones history has already shown us. The Core 6 puts six real eras against your plan, marks every place it runs short, and hands you the levers to fix them.
A plan you have pressure-tested against real history is not a plan you have to worry about. It is one you can trust.
Frequently Asked Questions
What is the Core 6 in Optiml?
The Core 6 is a set of six default historical stress scenarios that run automatically on every new plan you build in Optiml. Each scenario models a real market era, from the long-run average to the 2008 crash, the Great Depression, the 1966-82 high-inflation years, the 2000-09 lost decade, and the 1982-99 bull market, using a specific combination of average growth, a year-by-year return range, and average inflation. Each returns a Pass or Fail, and the six roll up into a Plan Score out of 100 on your Plan Summary.
How is the Core 6 different from the Success Score?
The Success Score measures broad statistical resilience, built from 50 market scenarios drawn from more than 50,000 generated return paths using a Monte Carlo approach. It answers how often your plan holds across thousands of possible futures. The Core 6 is the opposite lens: six specific, named historical eras you can point to and reason about, answering whether your plan survives each one. They are complementary, not a replacement for one another.
Does the Core 6 apply to my existing saved plans?
No. The Core 6 is not retroactive. It runs on new plans you build going forward and does not reach back to reprocess plans saved before the feature existed. To see the Core 6 on an older strategy, rebuild the plan fresh.
What is a good Plan Score?
There is no universal target. The right Plan Score depends on your plan, your goals, and your risk tolerance. What matters more than the number is what a Fail tells you: it flags exactly which era your plan struggles under and, via the Failed Scenario Details tab, the specific year it runs short. That is where to focus, rather than chasing a single headline figure.
Can I change the six scenarios?
Yes. The six defaults are fully overridable. You can name and configure your own custom scenarios, such as a sustained inflation shock or a flat market, and set their growth and inflation parameters to run on every plan going forward.
What is a Plan Score?
The Plan Score is a single number out of 100 shown on your Plan Summary that summarizes how your plan performs across the six Core 6 scenarios. Each scenario returns a Pass or Fail, and those results roll up into the Plan Score, giving you a fast read on how your plan holds across the full spread of market history.
Ready to optimize your retirement plan?
Join thousands of Canadians making smarter financial decisions with Optiml.
Start Free Trial