

Everyone tells you that compounding is magic. Start early, be patient, let time do the work. It sounds effortless.
But if you have ever actually tried to build wealth from zero, you know the first stretch does not feel like magic. It feels like pushing a car uphill. You put money away month after month, you check the balance, and the growth barely registers. That is not a sign you are doing it wrong. That is exactly how the road is supposed to look at the start.
Charlie Munger, Warren Buffett's longtime business partner, put it plainly at a Berkshire Hathaway meeting in the 1990s: the first $100,000 is the hardest part. Get past it, he said, and things get easier from there. He was right, and the math shows precisely why.
The first stretch is almost all you
Let's use a simple, consistent example: you invest $1,000 a month, starting from $0, at an 8% average annual return. I'll come back to why 8% is a reasonable illustrative number for Canadian markets later. For now, just watch what the money does.
In the first year, you barely notice returns at all. You contribute $12,000, and growth adds only a few hundred dollars on top. The account is almost entirely made of your own deposits. That's the reality early on: you are the engine. Not the market. You.
The first $10,000 shows up in under a year. That part feels good, a little breathing room. Then comes the long climb. In this example, reaching your first $100,000 takes about 6.4 years of steady $1,000 months. Six and a half years of discipline for six figures. No shortcuts, no magic, just contributions stacking up while returns quietly build in the background.
The crossover: where your money starts pulling its weight
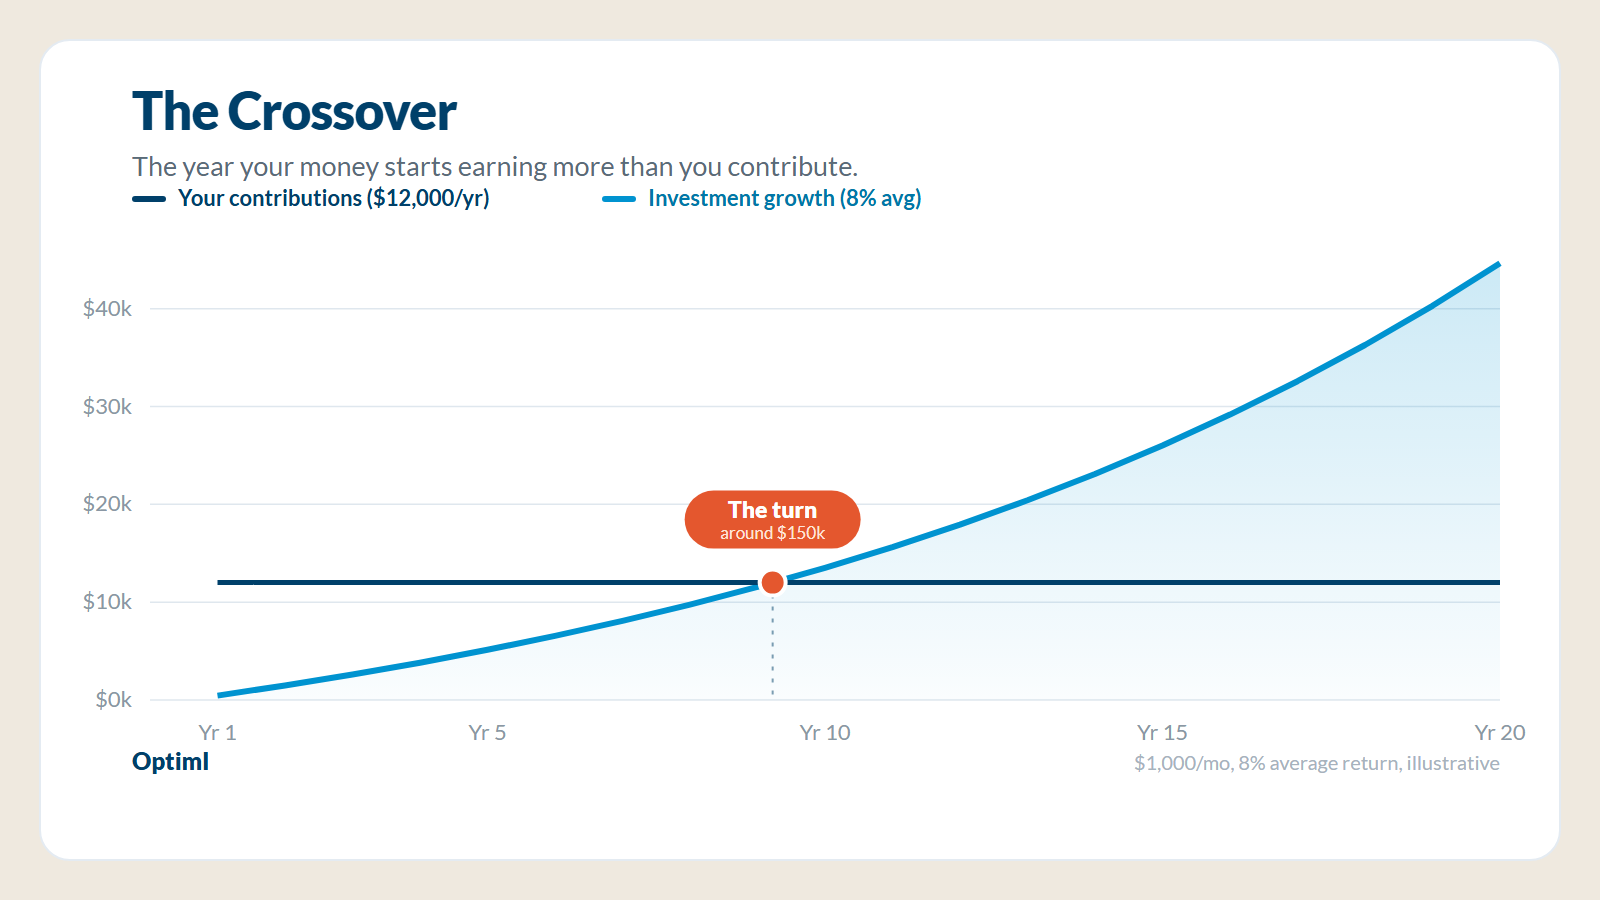
Here is the moment worth waiting for. Somewhere around $150,000, at an 8% average return, a single good year earns roughly $12,000. That is the same amount you put in yourself over a full year of $1,000 months.
That is the crossover. The point where your money starts pulling as hard as you do. Before it, your contributions carry the account. After it, you have a second engine running alongside you, and that engine never gets tired, never skips a month, and never asks for a raise.
Why the boring road is where people quit
The problem is that the crossover sits years down the path, and the years before it are quiet. You save and save, and the account still feels small. Meanwhile life keeps happening.
The car needs a transmission. You relocate for work and eat the moving costs. The kids get more expensive every single year. The house needs a roof, and the roof does not care about your contribution schedule. And through all of it, someone you know is driving the new truck or posting from a trip you could not justify.
That is the real cost of the first $100,000. Not the money. The patience. The quiet stretch where the discipline is invisible and the payoff is still theoretical.
This is exactly when most people step off the path. Not because the math failed them, but because the boring part lasted longer than their conviction did.
Robert Frost wrote about this kind of choice more than a century ago, in The Road Not Taken:
"I took the one less traveled by, / And that has made all the difference."
The less-travelled road is less crowded for a reason. It is unglamorous for a long time. But the reason it stays worth taking is on the other side of the quiet years.
The second half of the road
Once you clear the crossover, the whole character of the journey changes. Early on, you were the engine. Now the money is a second engine, and it starts carrying more of the load than you do.
At an 8% year, $250,000 earns around $20,000. Half a million earns around $40,000. A million earns around $80,000. Notice that last one: at that point, the portfolio is generating in a single year more than six times what you contribute yourself.
And here is the part that surprises people most. On this same path, going from $500,000 to $1,000,000 takes only about seven more years, even though you are adding five times the wealth you added getting to your first $100,000. That is the moment compounding stops being a finance term and starts showing up as real dollars in your account.
The first $100,000 took 6.4 years. The last $500,000 of your first million takes about seven. Roughly the same stretch of time, ten times the result. That is not a trick. That is the second engine doing what it does.
Where Canadians run this math
For most Canadians, this whole journey happens inside two accounts: your RRSP (Registered Retirement Savings Plan) and your TFSA (Tax-Free Savings Account). They are the vehicles built for exactly this kind of long, patient accumulation, and the tax treatment on both means more of every 8% year stays in your pocket instead of being taxed along the way.
If your employer offers a group RRSP match, that is free money layered on top of your own contributions. Taking the full match is one of the few genuinely easy wins on the entire road, so take all of it.
And about that 8%. I used it because it is honest, not optimistic. Over the long run the S&P/TSX Composite has averaged roughly 9% nominal (about 6% after inflation), with 10-year rolling returns historically landing somewhere in the range of 5% to 14%. So 8% is a reasonable, slightly conservative average to illustrate the shape of the road. It is context, not a forecast. Real returns are lumpy, some years are negative, and no year is promised. The point is not the exact number. It is the pattern it reveals: contributions carry you first, then growth takes over.
Seeing your own crossover
The frustrating thing about the crossover is that you cannot feel it coming. On any given month, the account just looks like the account. You can't tell whether you are one year from the turn or five.
This is where modelling your full horizon helps. Optiml projects your entire timeline and can show the actual year your portfolio's growth is set to overtake your own contributions, the crossover made concrete for your numbers, not a generic chart. Your Success Score turns that same trajectory into a resilience number out of 100, so patience stops being a feeling and becomes something you can see. And if you are earlier on the road and just want a free first look at where your path is heading, Optiml Lite is a no-commitment place to start.
The Bottom Line
Slow progress is not failure. Slow progress is expensive, real progress that simply has not compounded yet.
The quitting point almost always sits right before the math turns. People push the car uphill for years, then step away just as the road starts to flatten out. The road less travelled looks lonely for a long time, and for years it can feel like everyone else is ahead of you.
Then the math turns. And that can make all the difference.
Frequently Asked Questions
Why is the first $100,000 considered the hardest?
Because at the start, almost all of your growth comes from your own contributions rather than investment returns. There is not enough capital yet for compounding to add much. Charlie Munger's point was that once you accumulate that base, returns begin doing a meaningful share of the work, and the climb gets easier.
What is the crossover point?
It is the moment your investment growth in a single year matches what you contribute yourself over that year. In this example, at $1,000 a month and an 8% average return, it happens around $150,000, where one 8% year earns roughly $12,000, the same as a full year of contributions.
Is 8% a guaranteed return?
No. Nothing here is a promise or a forecast. The 8% figure is an illustrative long-run average used to show the shape of the journey. The S&P/TSX Composite has averaged roughly 9% nominal over the long run, with plenty of negative years mixed in. Your actual returns will vary year to year.
Which accounts should Canadians use to build this base?
For most people, the RRSP and TFSA are the core accumulation accounts, thanks to their tax treatment. If your employer offers a group RRSP match, contributing enough to capture the full match adds free money on top of your own savings.
How can I tell when my own crossover will happen?
You cannot feel it month to month, but you can model it. Optiml projects your full timeline and can show the year your portfolio's growth is set to overtake your contributions, and your Success Score turns that trajectory into a resilience number you can track over time.
Ready to optimize your retirement plan?
Join thousands of Canadians making smarter financial decisions with Optiml.
Start Free Trial